
The View our Progress page provides information on Penn State’s sustainability performance. Penn State Sustainability is actively working with our campus partners to gather the necessary information and data to keep these dashboards up to date. New information is published when it becomes available. The latest dashboard updates have been accomplished by our talented Sustainability Data Interns – Seungjae Lee and Linh Tran.
For more information on the dashboard or sustainability efforts at Penn State, please contact us at sustainability@psu.edu.
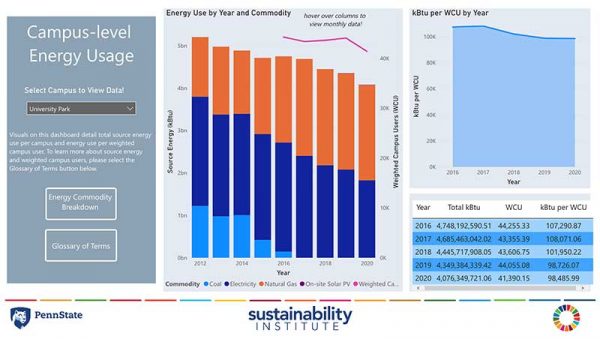
This dashboard details total source energy usage per campus, including energy use per weighted campus user. Click in to view energy commodities by year and filter by campus.
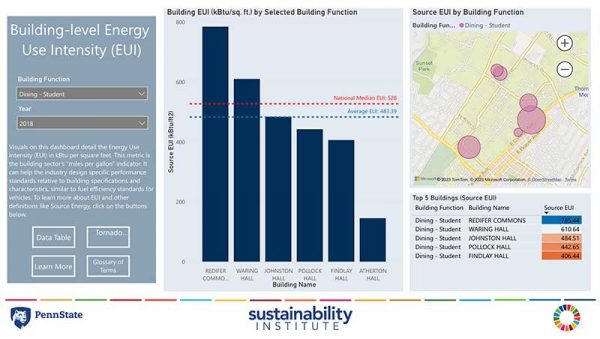
This dashboard details energy use intensity (EUI) per building function and year. Click in to see data tables and charts that showcase building level energy usage.
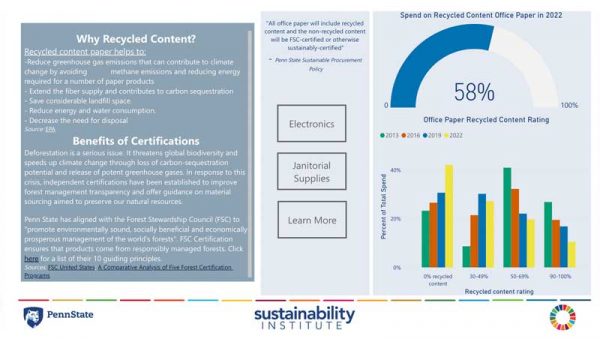
This dashboard showcases procurement data that meet sustainability standards. Categories include Electronics, Office Paper, and Janitorial Supplies. Click in to learn more.
This dashboard contains total fleet vehicles by fuel type and a breakdown of commute modes for faculty, staff, and students. Click in to learn more.

This dashboard details total waste generation for the University Park campus. Click in to see data tables, filter by traditional waste streams, and learn more about Penn State’s efforts to effectively manage their waste.
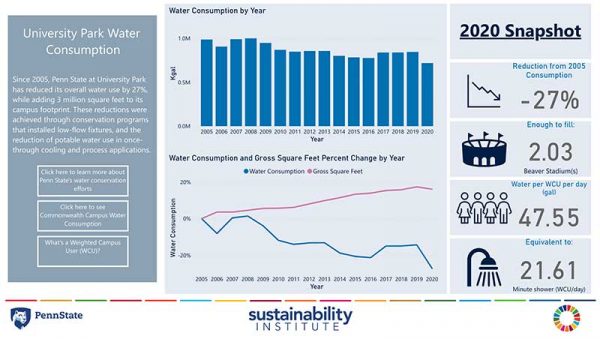
This dashboard showcases total water consumption by campus. Click in to see campus-level data and learn about Penn State’s ongoing water conservation efforts.
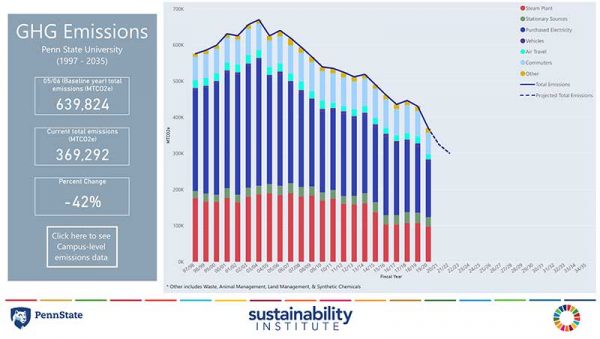
This dashboard details Penn State’s greenhouse gas emissions by sector and scope. Click in to see totals, a breakdown by campus, and emissions per weighted campus users.